Products
TDI Trading Indicator
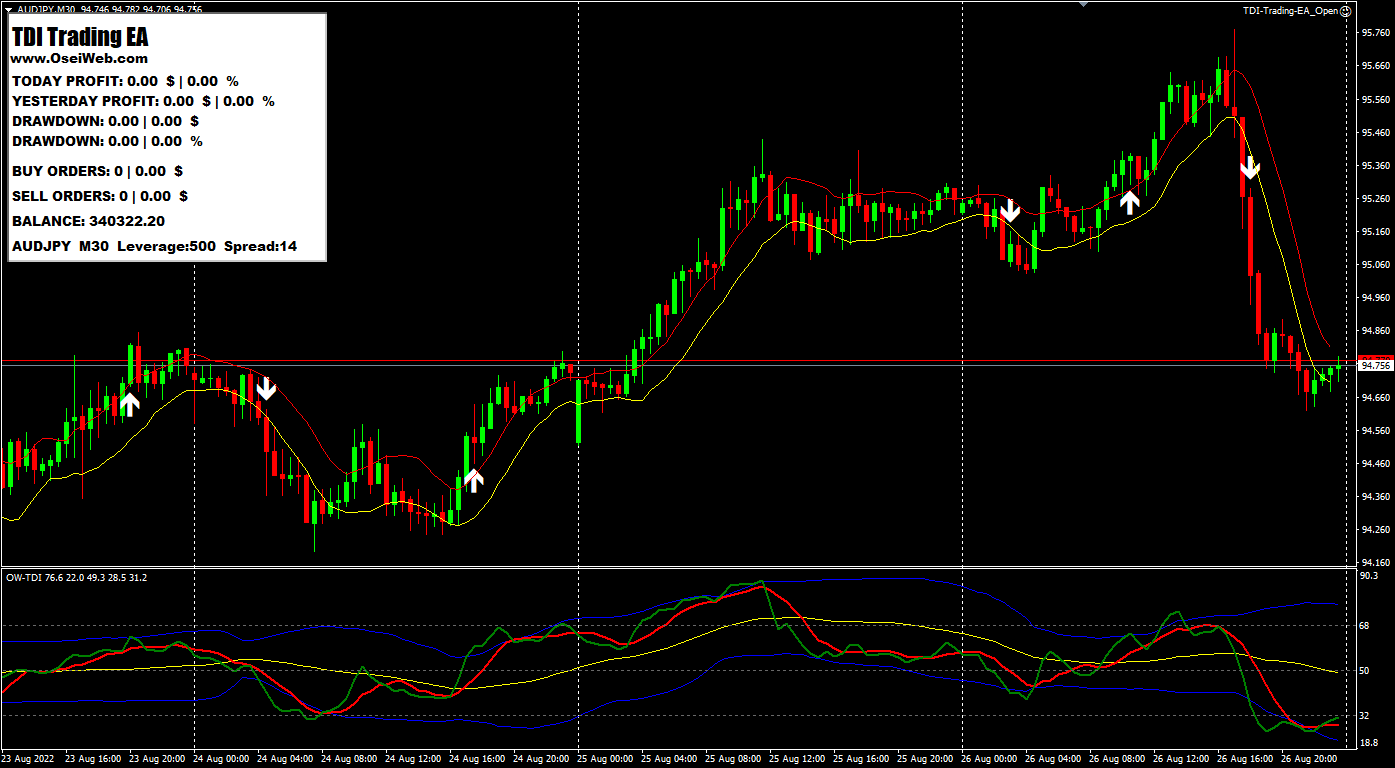
What is the TDI indicator? The Traders Dynamic Index indicator is the only technical indicator you need to scalp the market successfully. The TDI is the only technical indicator that can read the market sentiment, market volatility, and momentum at the same time.
This indicator and EA allow you to create a trading strategy using TDI, with Price Action Channels, Heiken Ashi, and Moving Averages as filters. Everything in the EA and Indicator can be customized.
Strategies:
Strategy 1: Buy: Green > Blue, Red, Yellow, 50 Line (Green < 68)
Strategy 1: Sell: Green < Blue, Red, Yellow, 50 Line (Green > 32)
Strategy 2: Buy: Green line cross above Yellow, Red, above the 50 line, and cross above the upper Blue
Strategy 2: Sell: Green line cross below Yellow, Red, below the 50 line, and cross below the upper Blue
Strategy 3: Buy: Green line cross above Yellow & Red
Strategy 3: Sell: Green line cross below Yellow & Red
Strategy 4: Buy: Green line cross above lower Blue Band, and crosses above the Red
Strategy 4: Sell: Green line cross below upper Blue Band, and crosses below the Red
Strategy 5: Buy: Green above Red & Yellow above 50
Strategy 5: Sell: Green below Red & Yellow below 50
Strategy 6: Buy: Green above Red
Strategy 6: Sell: Green below Red
All purchases are final. There is no refund after purchase.